
DisasterMap just got a massive update
Ice age coastlines, 16,000 fault lines, 1,215 volcanoes, live earthquakes, 100,000+ megalithic sites, and a lot more

It’s been a busy few weeks at DisasterMap.ca
Here’s everything that just shipped.
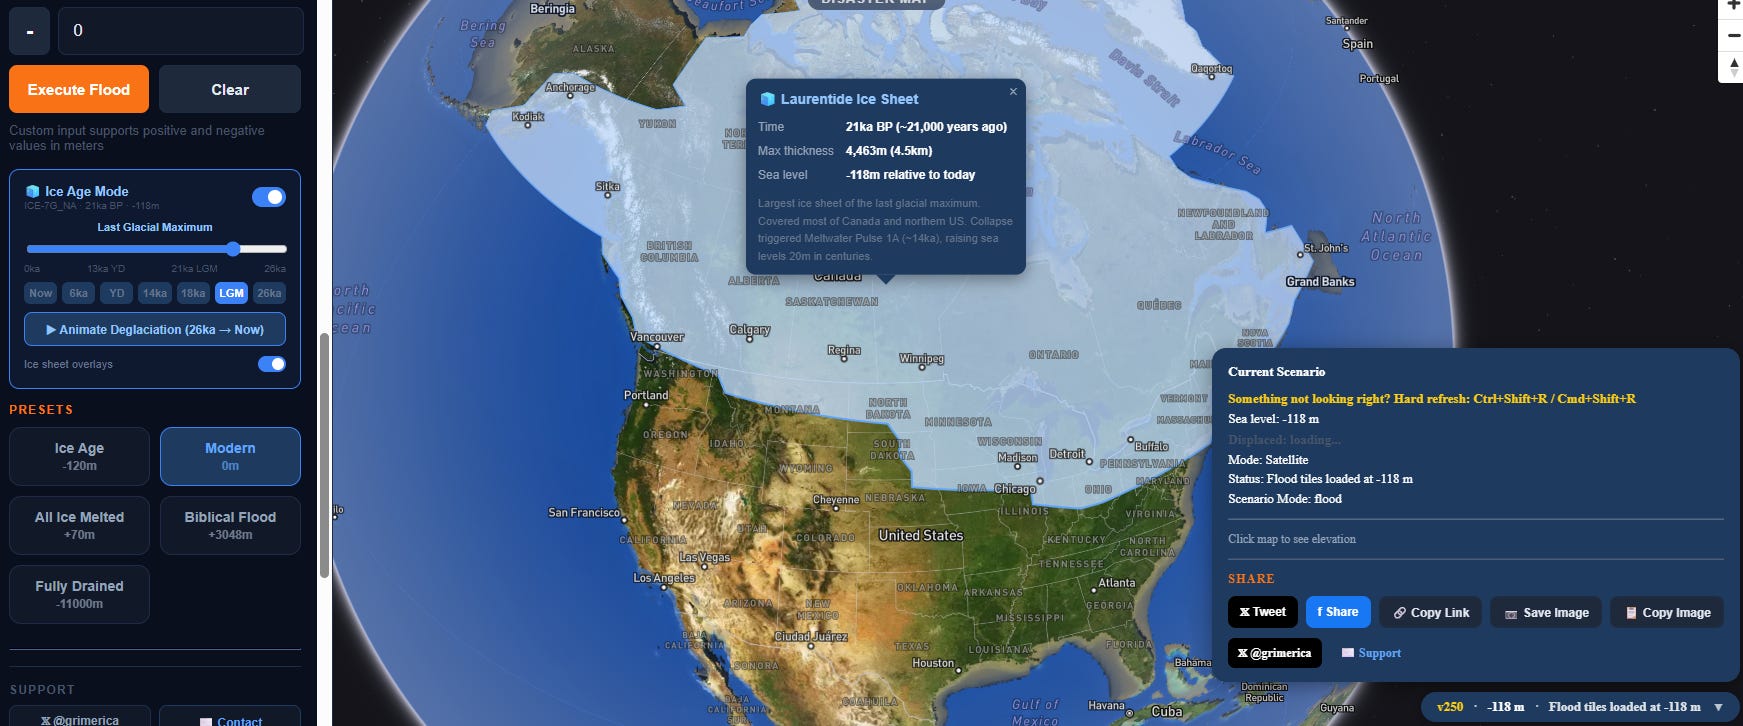
🧊 Ice Age Mode
Drag the slider back 26,000 years and watch the ocean drain.
Using ICE-7G_NA paleo-topography data — 48 time slices from the Last Glacial Maximum to present — you can now watch Doggerland rise between Britain and Europe, Beringia connect Alaska to Siberia, and Sundaland emerge from the South China Sea. The Laurentide, Fennoscandian, British, and Barents-Kara ice sheets appear with their actual max thickness and geological context. Click any ice sheet for a popup with time period, thickness in km, and sea level relative to today.
Hit Animate Deglaciation and watch 26,000 years of sea level rise play out in real time. Era presets: Now · 6ka · Younger Dryas · 14ka · LGM · 26ka. Toggle ice sheet overlays on or off independently.
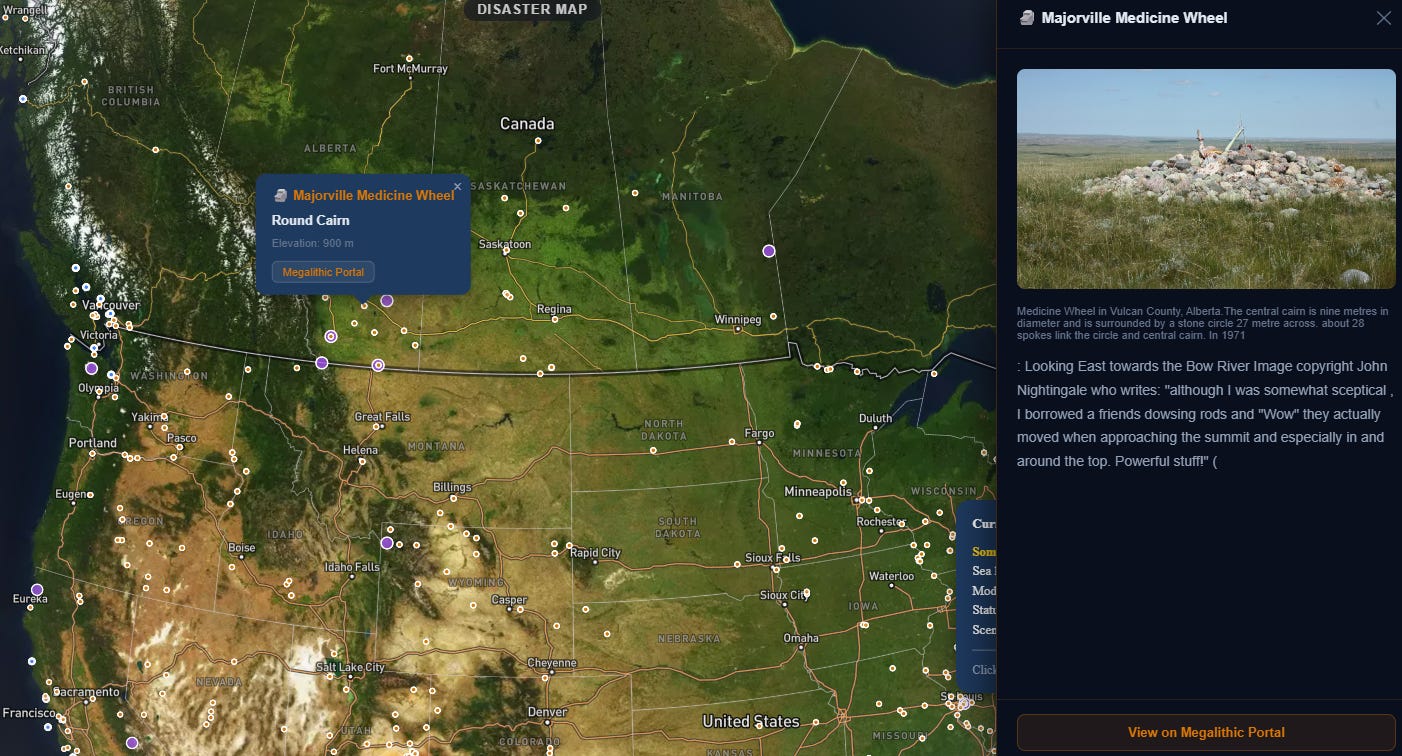
🗿 100,000+ Megalithic Sites — with photos and info
Every stone circle, dolmen, cairn, menhir, and standing stone in the Megalithic Portal database is now on the map. That’s over 100,000 sites worldwide.
Find Sites Near You!
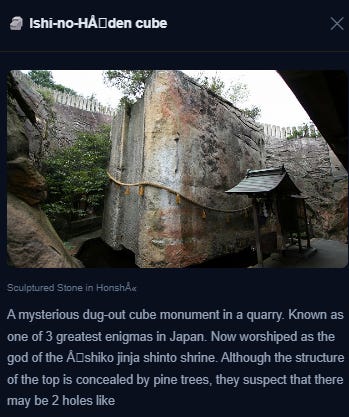
Click any site and a slide-in panel opens with the site’s photo, full description, type, elevation, and a direct link to the Megalithic Portal. Majorville Medicine Wheel in Alberta. Stonehenge. Callanish. Sites you’ve never heard of on islands and hilltops across Europe, the Middle East, and beyond.
Toggle on Ice Age Mode and every megalith popup now tells you whether the site was above or below sea level at any given epoch — and by how much. Sites on the now-submerged Doggerland shelf light up as underwater. Coastal sites in Ireland show their relationship to a coastline that looked completely different 8,000 years ago.
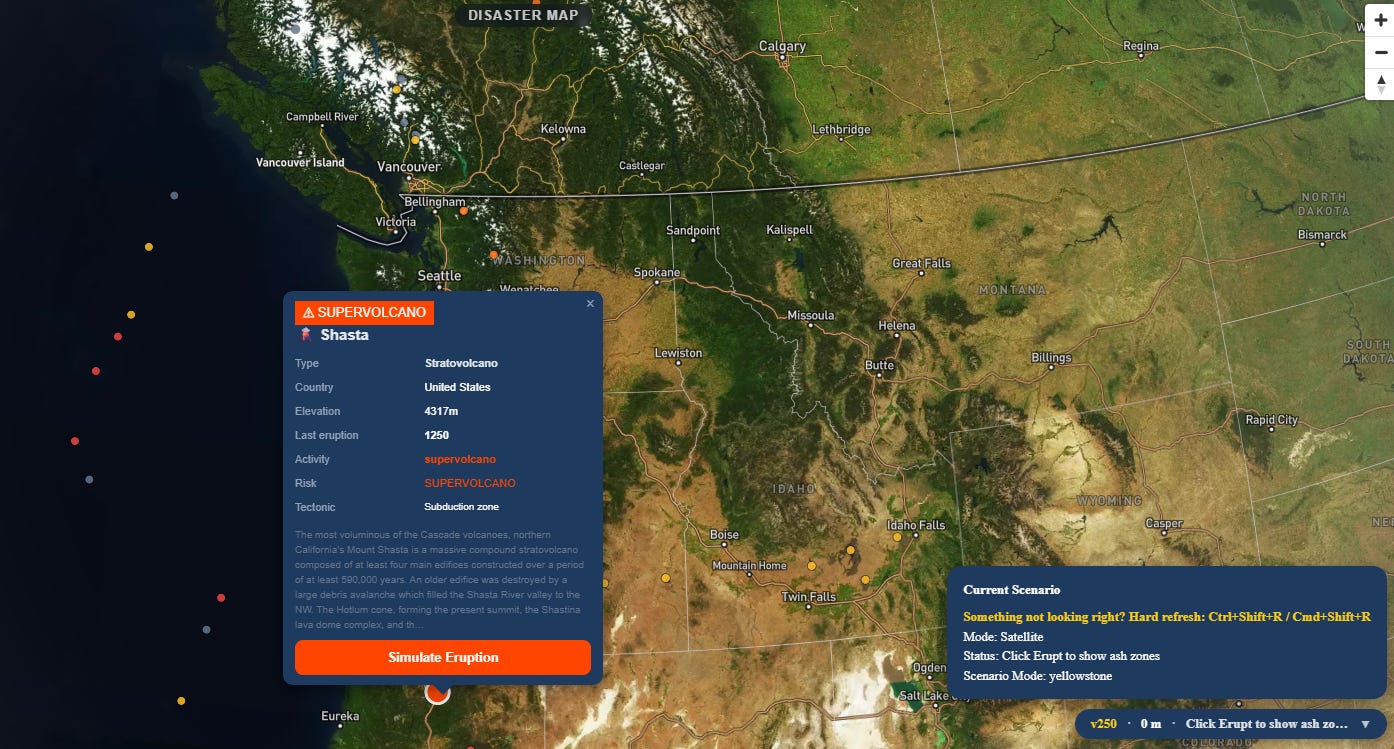
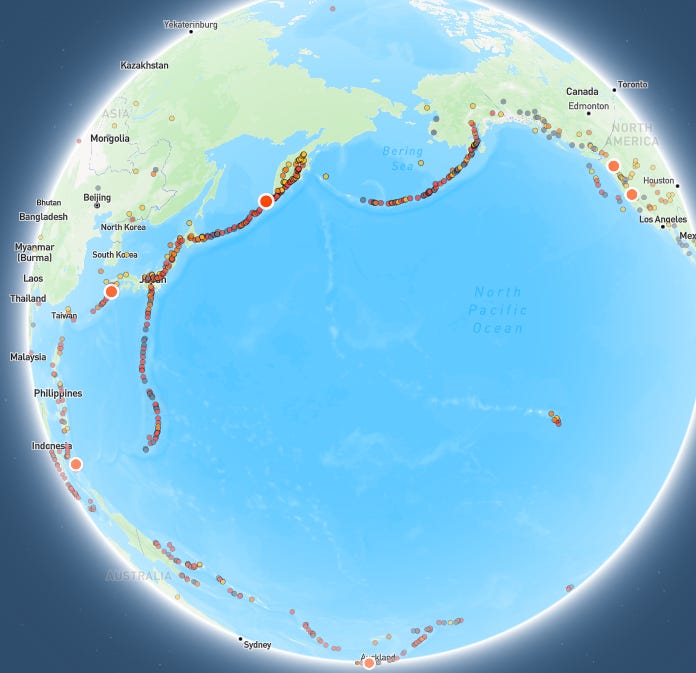
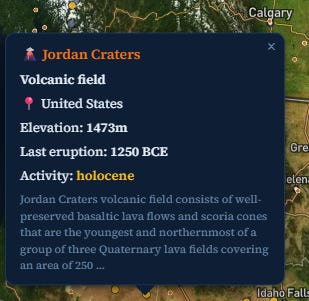
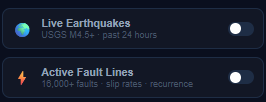
🌋 1,215 Volcanoes — simulate any eruption on Earth
The full Smithsonian Global Volcanism Program Holocene catalog is now on the map. Every volcano color-coded by activity level — click any for eruption history, VEI, tectonic setting, elevation, and a full description pulled from the GVP database.
Hit Simulate Eruption and the volcano’s parameters load directly into the eruption simulator — ash cloud zones, survival odds by distance, and casualty estimates based on population data.
26 currently-erupting volcanoes — Etna, Kilauea, Stromboli, Merapi, Nyiragongo, and others — pulse with a live red ring and an “🔴 ERUPTING NOW” badge in their popup.
Supervolcano presets (Yellowstone, Toba, Campi Flegrei) are free. Full eruption simulation is Pro.

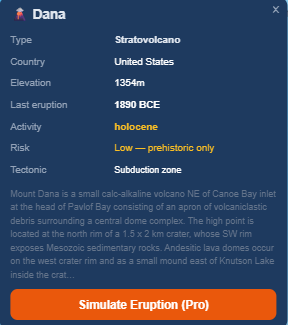
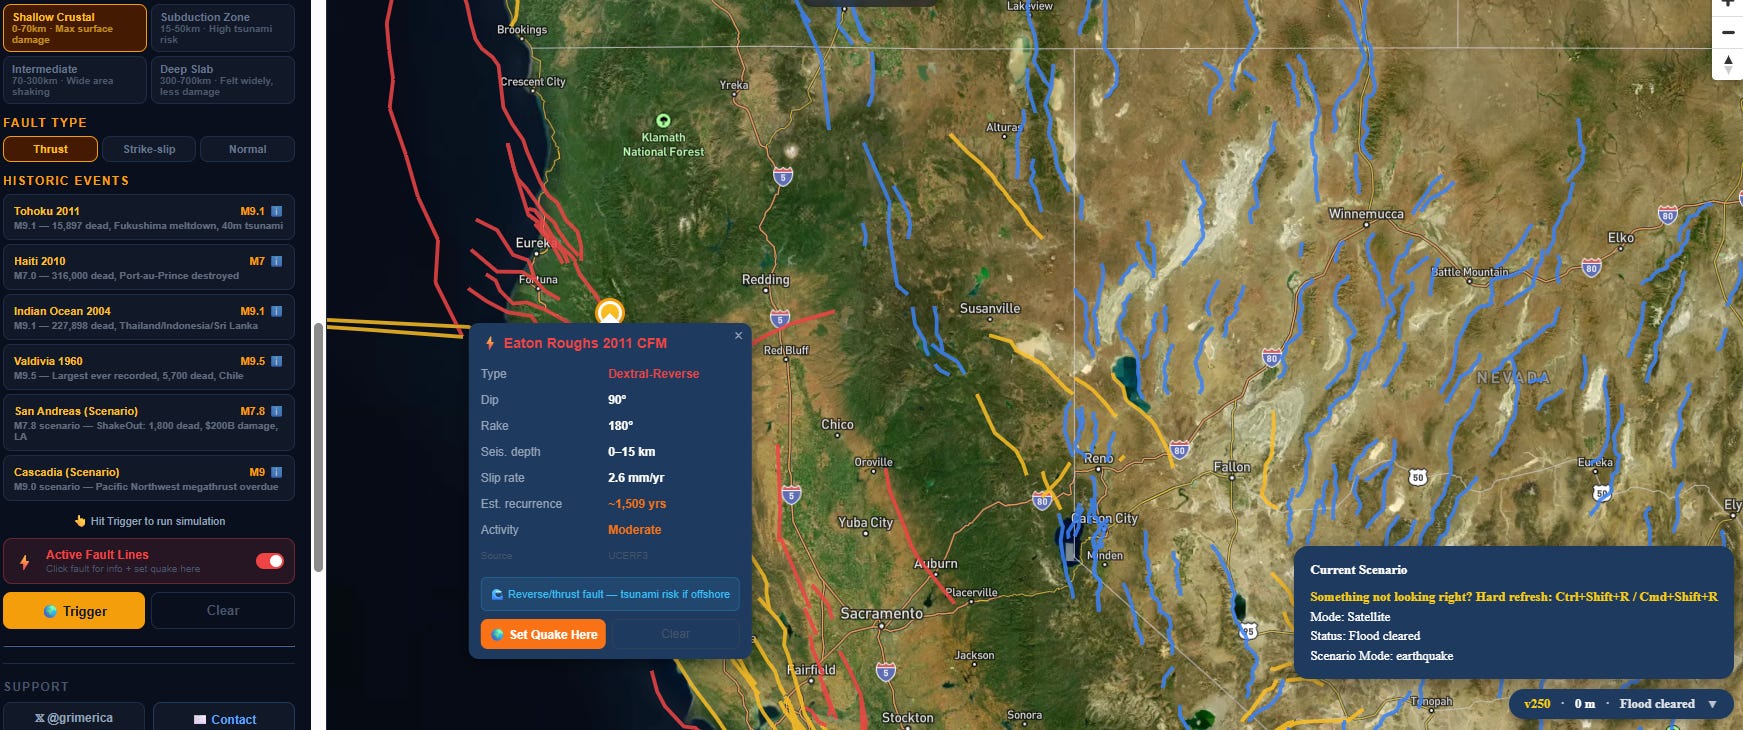
⚡ 16,000+ Active Fault Lines — click to set your quake
The GEM Global Active Faults dataset — every major active fault on Earth, colored by slip type. Red for thrust, yellow for strike-slip, blue for normal.
Click any fault and a popup shows slip rate, recurrence interval, seismogenic depth, dip, rake, and fault type. Hit Set Quake Here and everything — including the fault’s strike auto-computed from the actual fault geometry — loads directly into the earthquake simulator. One click from fault line to simulation.
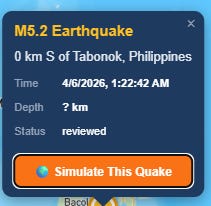
🌍 Live USGS Earthquake Feed
M4.5+ earthquakes from the past 24 hours, plotted live in Earthquake mode. Color-coded by magnitude — green M4.5+, yellow M5+, orange M6+, red M7+. Click any event for location, depth, time, and tsunami status.
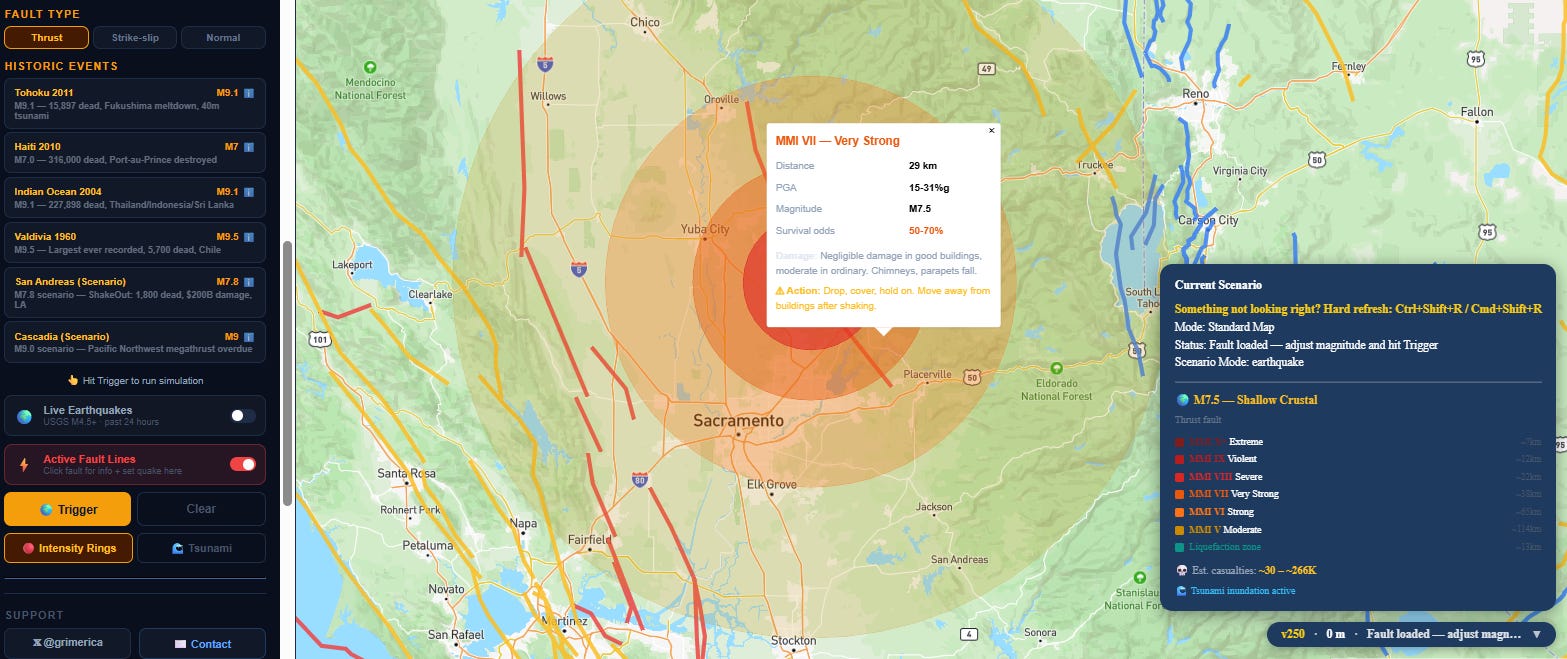
🌊 Earthquake + Tsunami
Historical presets now include Haiti 2010 and San Andreas scenario alongside Tohoku 2011, Indian Ocean 2004, Valdivia 1960, and Cascadia. Fault strike is now auto-computed from GEM fault geometry and pre-loaded into the simulator.
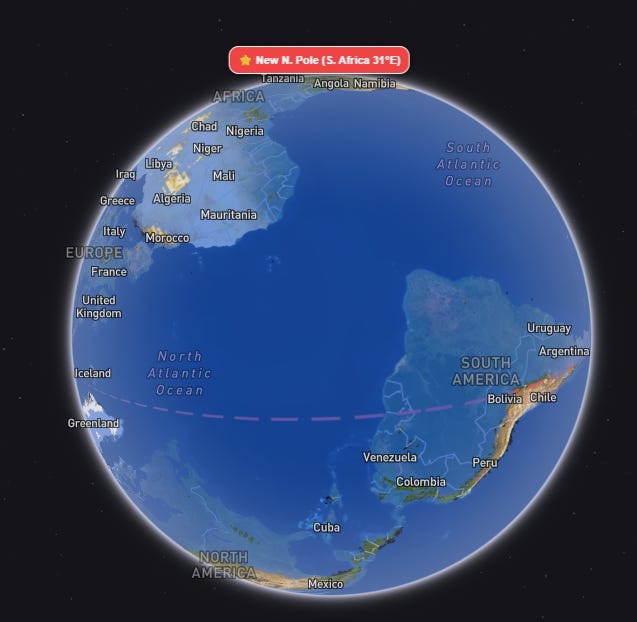
☄️ Pole Shift / ECDO Models (updated)
Cataclysm mode now includes the TES ECDO model (104° shift, South Africa new pole) alongside the Davidson/Suspicious Observers 90° model (Bay of Bengal new pole). Both animated on a 3D globe with surge masks, new pole markers, and inundation zones.
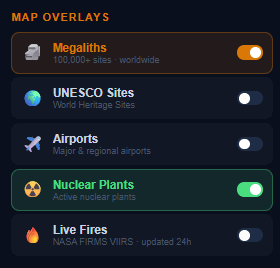
New Map Overlays — all toggleable
Six live data overlays now sit in the Map Overlays panel, all toggleable on any scenario:
🗿 100,000+ Megalithic sites — Megalithic Portal, with photos
🏛 UNESCO World Heritage Sites — 1,247 sites with Wikipedia panel
✈️ Airports — 42,000+ major and regional airports
☢️ Nuclear Plants — 421 active plants with capacity data
🔥 NASA Live Fires — FIRMS VIIRS updated every 24 hours
🌍 Live USGS Earthquakes — M4.5+ past 24 hours
Stack them. Run a flood scenario and see which nuclear plants go underwater. Enable Ice Age mode with megaliths on and see which ancient sites were coastal 12,000 years ago.
What’s next
Higher resolution terrain is building now — moving from GEBCO (450m) to NASADEM (300m) for sharper drain mode coastlines. Clerk migration to production and the full CIM classroom platform are in progress.
DisasterMap is free to use. Pro ($18.99 lifetime, founders price) unlocks fault lines, full eruption simulation, satellite view, and higher simulation limits.
— Built by @grimerica